 KLARiTY · for can making, PET and filling lines
Every can.
Every bottle.
One clear picture.
KLARiTY gathers the data and images from the inspection machines on your can making, PET and filling lines into one place: live dashboards, alarms, reports and an assistant that answers from your own production data.
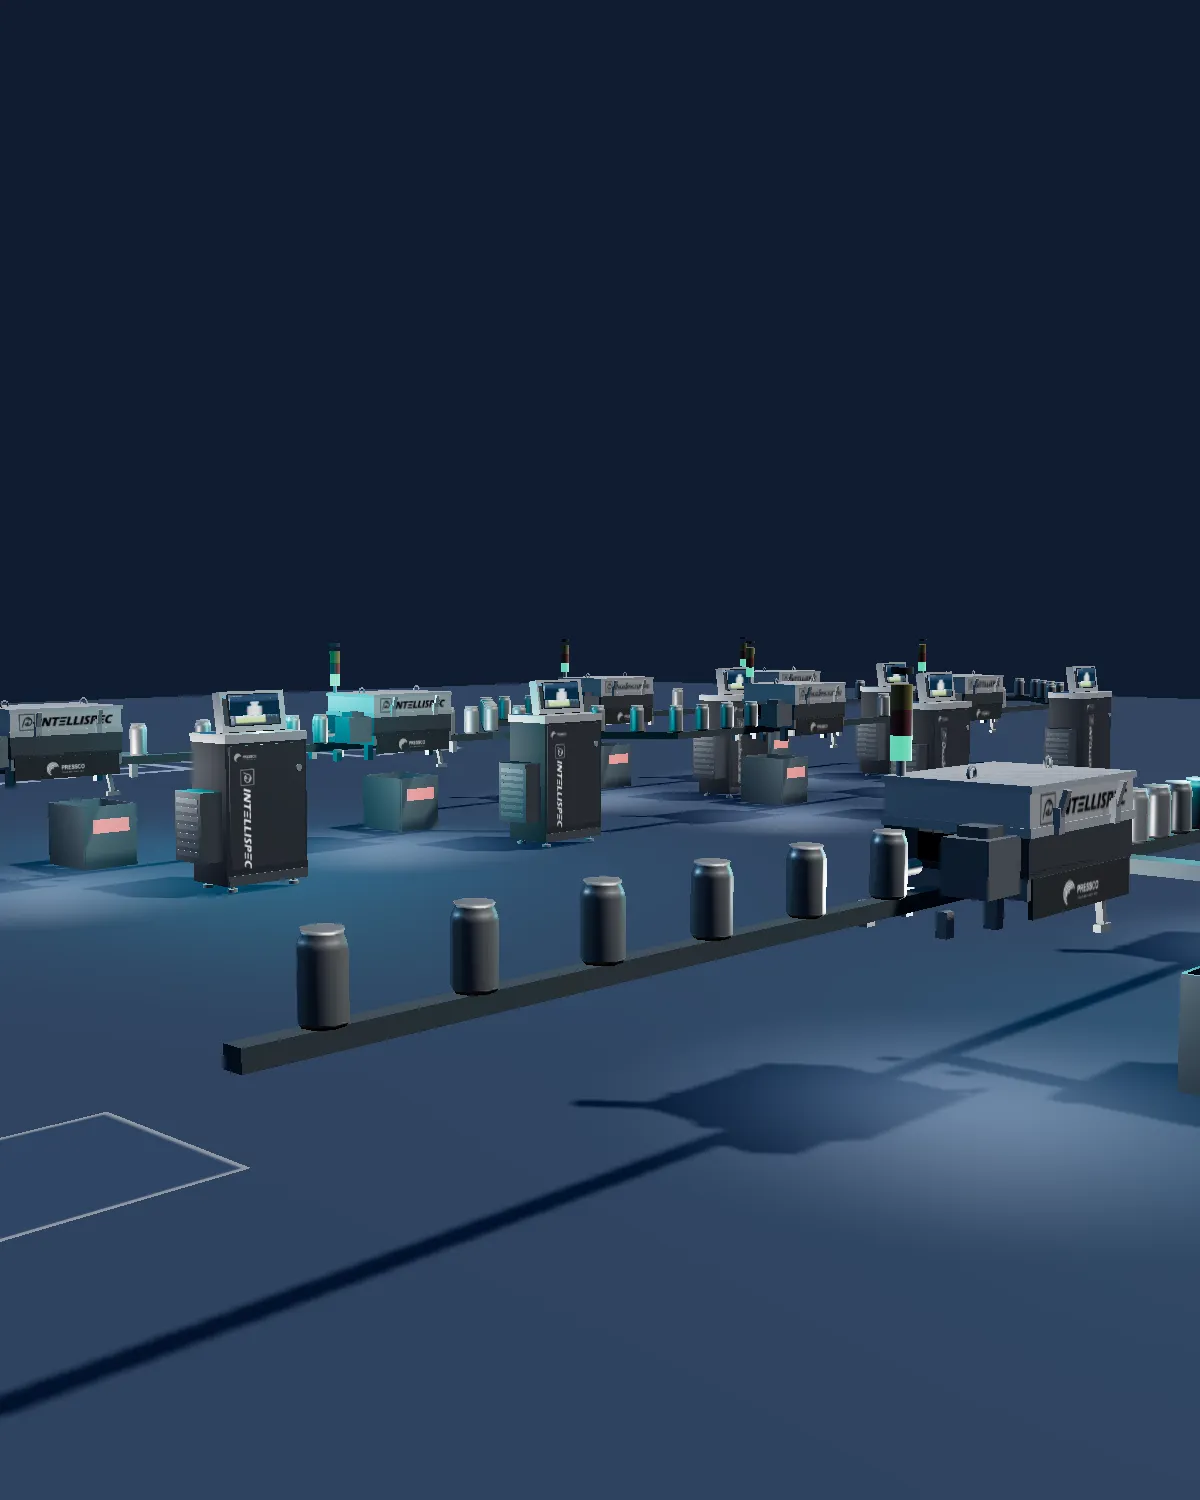
The same platform and the same modules as our glass plants, with a line template for each family.
Pick your line. Keep everything else.
Cans, PET or filling: KLARiTY draws the line you actually run, with the machines you actually have, and every dashboard, alarm, report and image follows.
Cans
Can making end to end: cupper, bodymakers, washer, decorator, necker, and the inspection between them.
See can makingPET
Preforms, blow moulding, inspection and packing, with the reject rate down to each blow-mould cavity.
See PETFilling
Filler, capper, labeller, coder, and the fill-level, closure and label inspection between them.
See fillingSpoilage by station, not by shift report.
Inside and outside inspection, decorator print inspection, light testers: KLARiTY brings their counters and images together, so you see where a can was lost, on which bodymaker or decorator, and what it looked like.
- Spoilage by machine, defect, SKU and shift
- The image of every rejected can, a click away
- Bodymaker and decorator trends, side by side with the counters
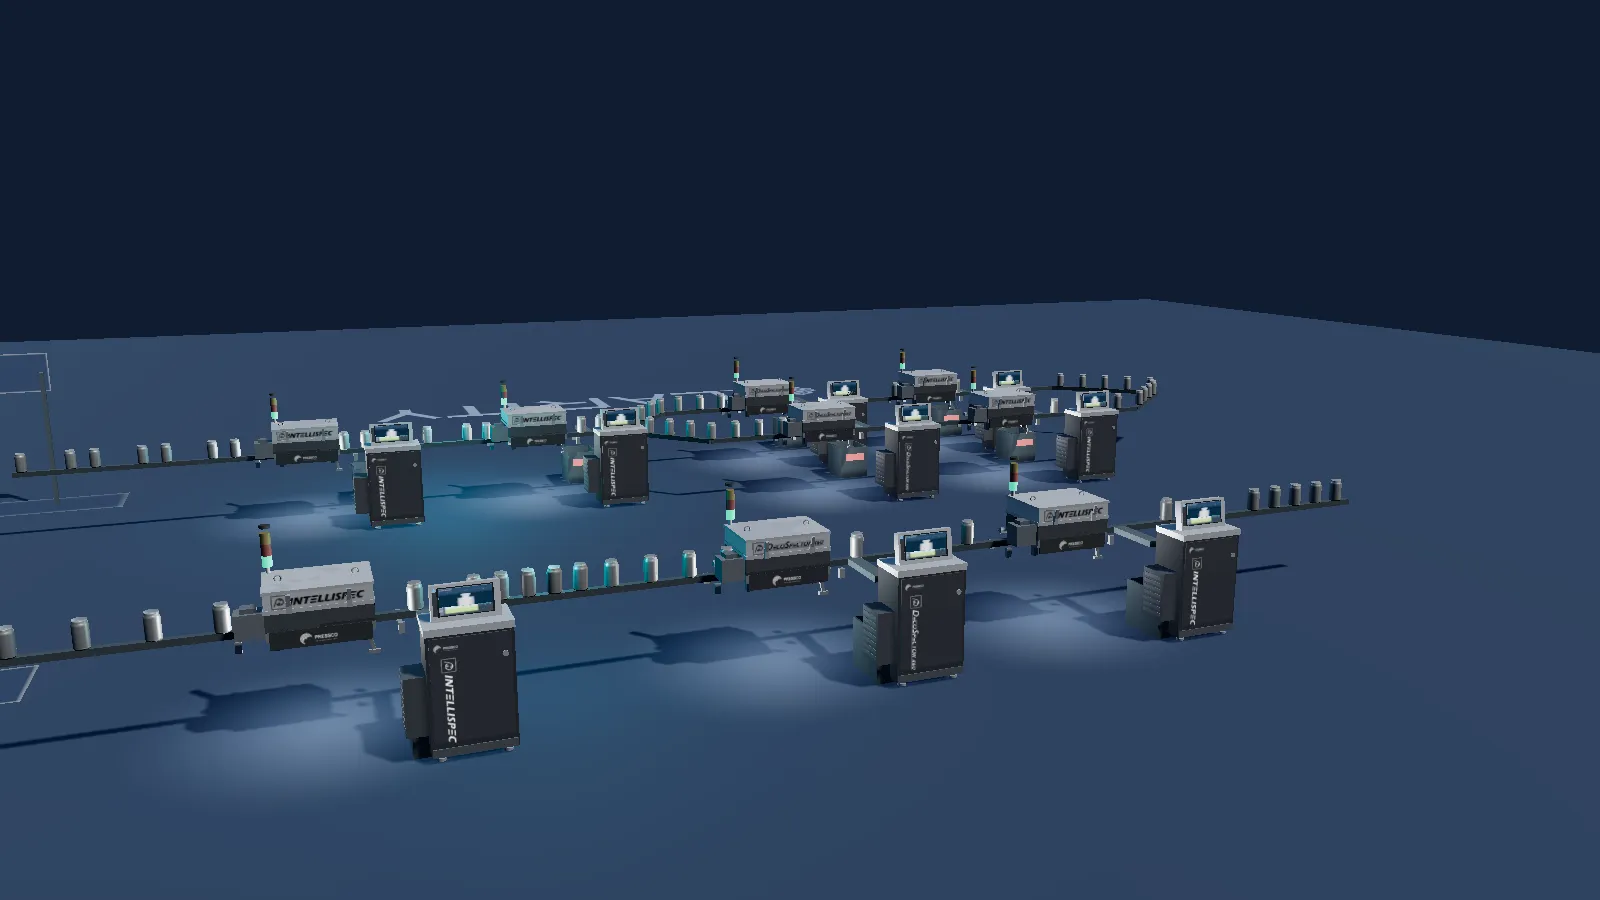
From preform to packed bottle, cavity by cavity.
Preform, base, body and neck-finish inspection feed the same dashboards as a glass plant. The reject rate goes down to each blow-mould cavity, and every rejected bottle keeps its image and its tags.
- Reject rate by blow-mould cavity and by defect
- Preform and bottle images in one gallery, filtered by your own tags
- SPC control charts on the measurements the machines already take
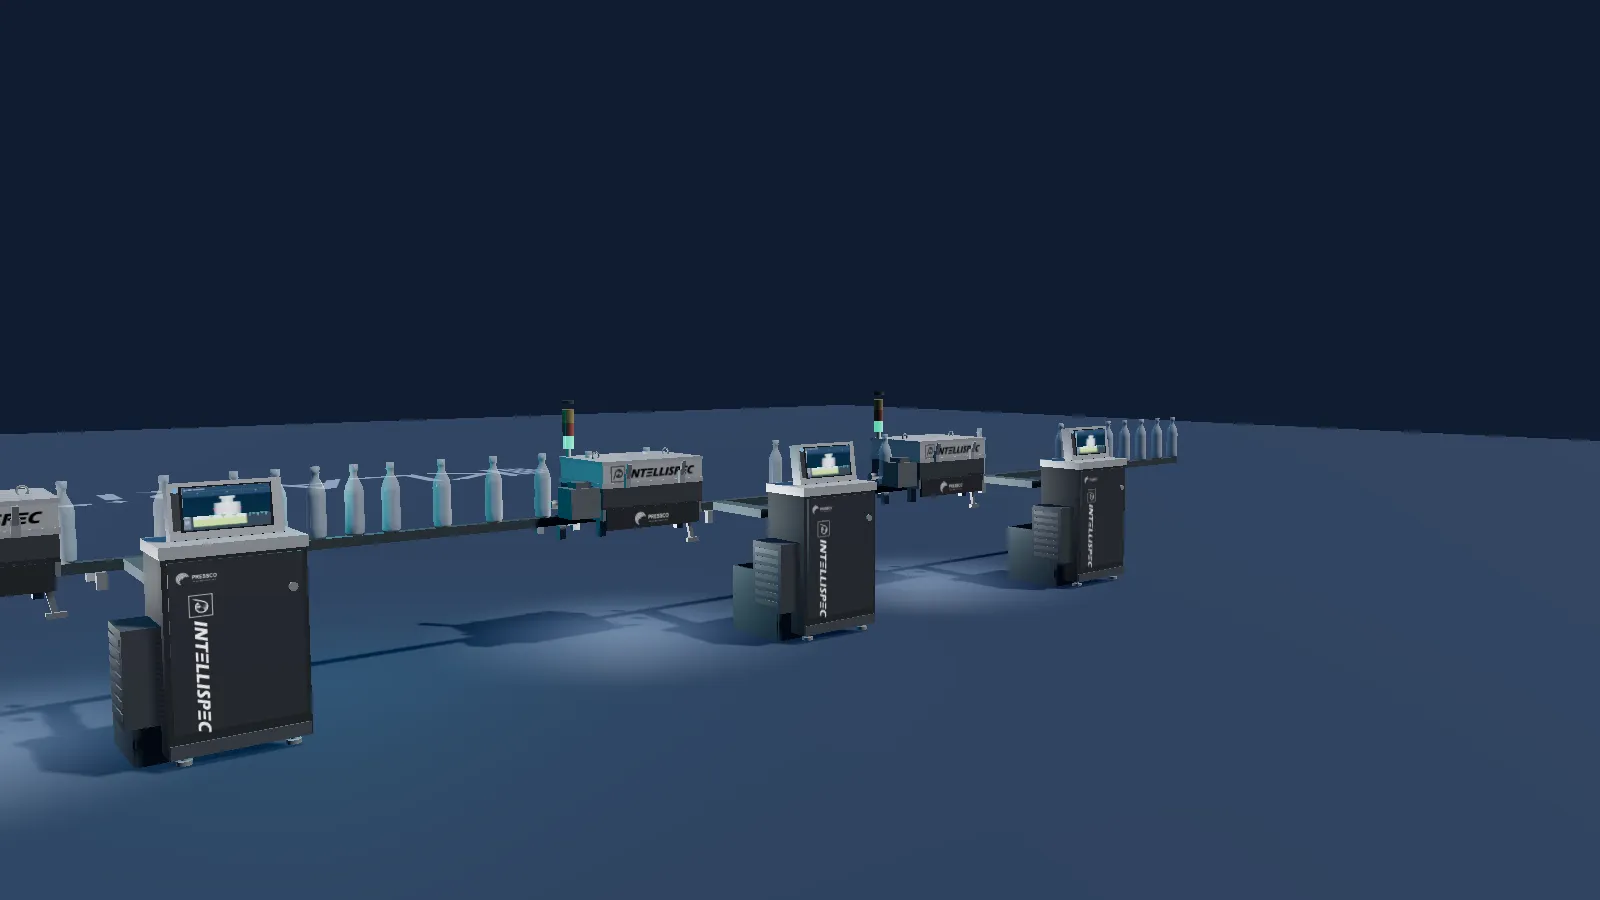
The whole filling line on one screen.
Depalletizer to palletizer: fill level, closure, label and code inspection, with the stoppages and downtime of every machine on the same timeline. When the filler slows, you see which inspection started rejecting first.
- Fill level, closure and label rejects by machine and by SKU
- Uptime, downtime and stoppages on one timeline
- Track & Trace from the depalletizer to the pallet
Everything our glass customers have. Nothing to relearn.
One sign-in, one hierarchy from the group down to each machine, and every module follows the scope you pick.
Dashboards
More than 50 widgets: reject rate, SPC, Pareto, heatmaps, uptime and downtime. Share them, or put them on the plant TV.
Image review
The image of every reject, by machine, defect and your own tags. Go back to the moment it started.
3D synoptic
Your lines drawn as they are, with a template for cans, PET and filling. Live status on every machine.
Alarms & reports
Thresholds and drift alarms by email, scheduled PDF reports for the morning meeting.
AI assistant
Ask in plain language. It answers from your production data and shows what it read.
Datamining
Correlate rejects with speed, events and settings, across lines and plants.
Track & Trace
Follow items and containers along the line and across the fleet.
iOS & TV mode
The plant in your pocket, and full-screen dashboards on the floor. 17 languages.
From the machine to your screen in seconds.
No change to the machines. KLARiTY connects the inspection machines and the plant systems you already own, and serves your data from a European cloud.
Machines and plant systems
Counters, results and images from the inspection machines, plus SCADA, MES, ERP and laboratory data.
KLARiTY connector
A small service at the plant collects and forwards, securely, with nothing exposed to the internet.
KLARiTY cloud
Google Cloud, hosted in the European Union. Encrypted in transit and at rest.
Your team
Web, plant TV and iOS. Accounts approved by your organisation and by ours.
Let’s talk about your lines.
A 30-minute call with the KLARiTY team: your plants, your machines, and what you would see on day one.
The button opens an email to the KLARiTY team. We come back to you with a few time slots.
Making glass containers? See KLARiTY for glass plants