 KLARiTY · a Kestrel Vision solution
Every container.
Every line.
One clear picture.
KLARiTY gathers the data and images from the inspection machines of your glass plants into one place: live dashboards, alarms, reports and an assistant that answers from your own production data.
Running in glass plants across Europe, North America and Asia-Pacific.
Dashboards that keep up with the line.
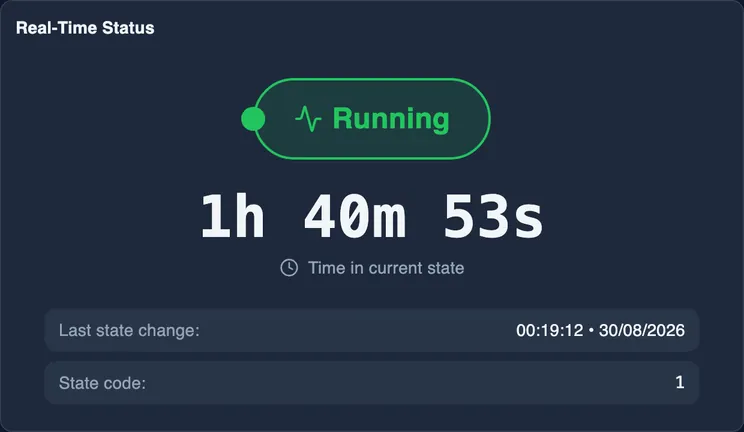
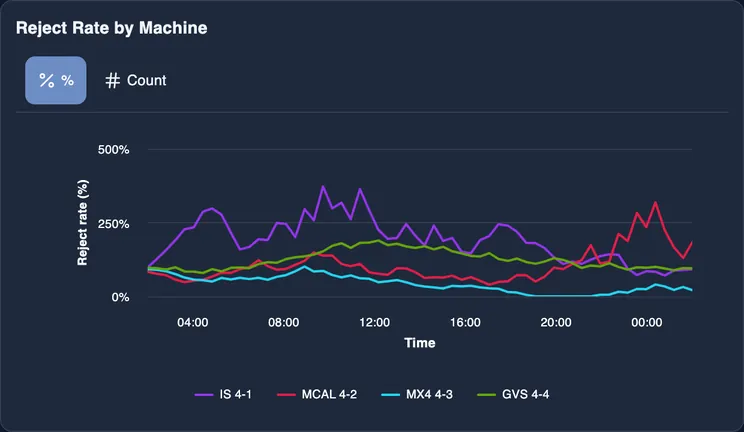
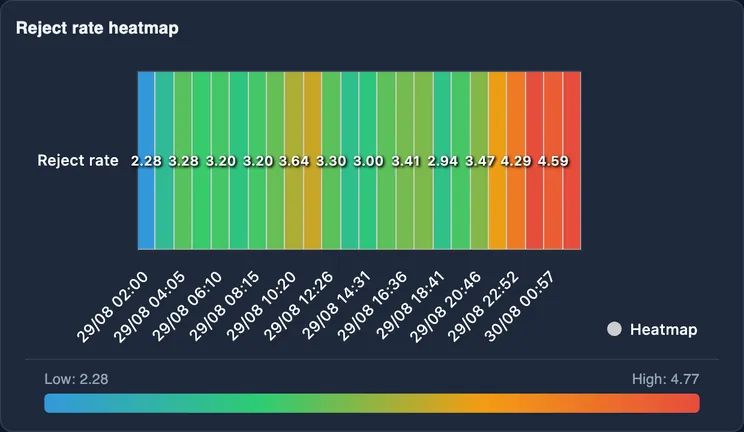
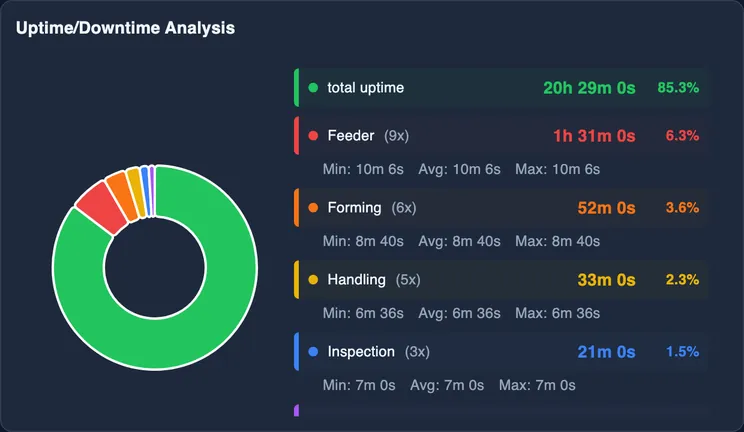
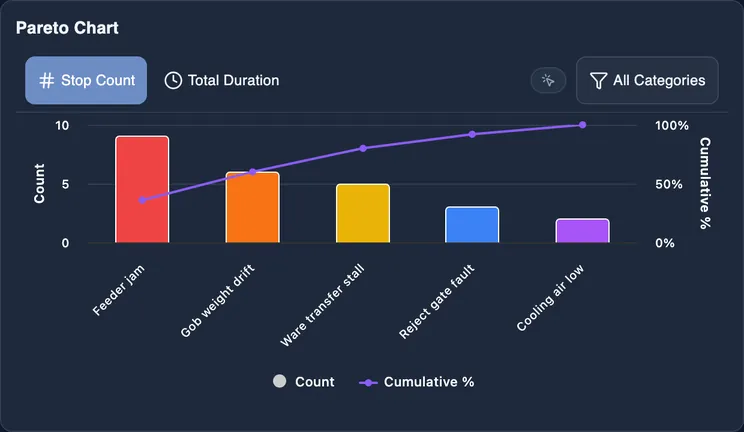
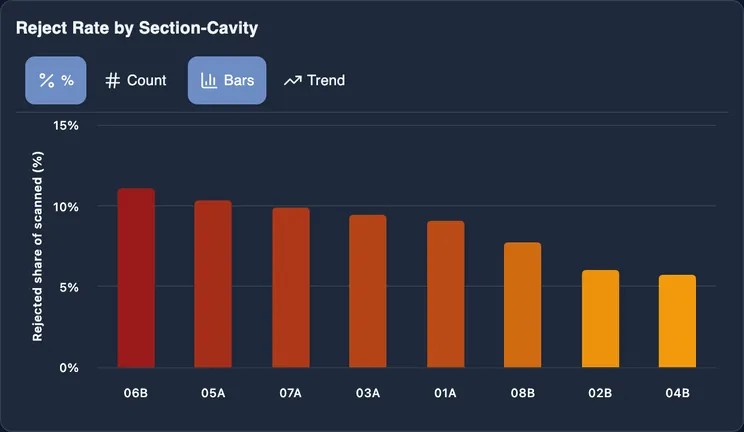
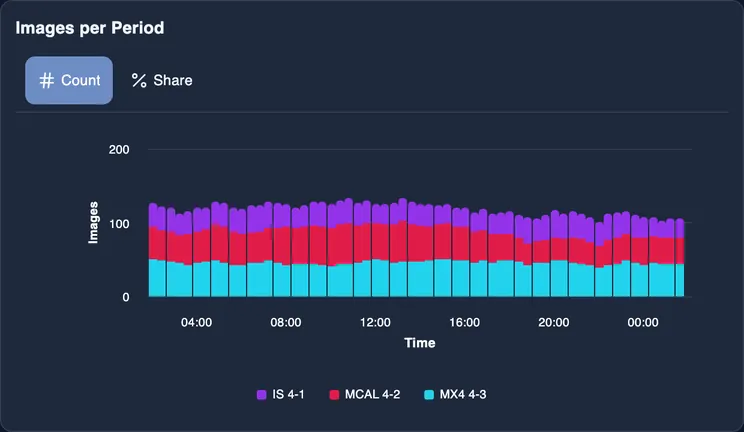
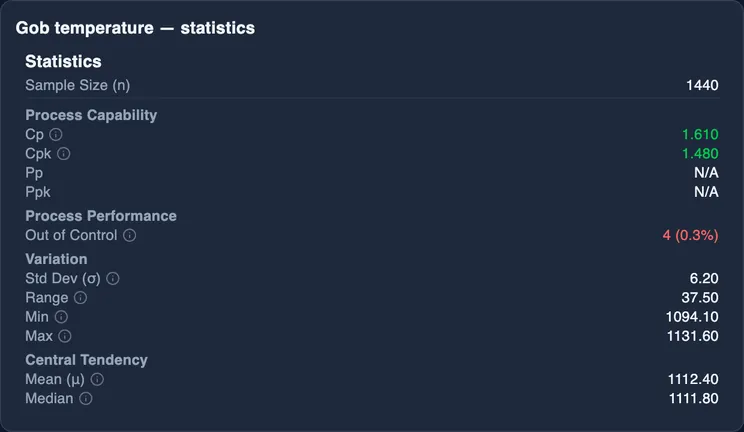
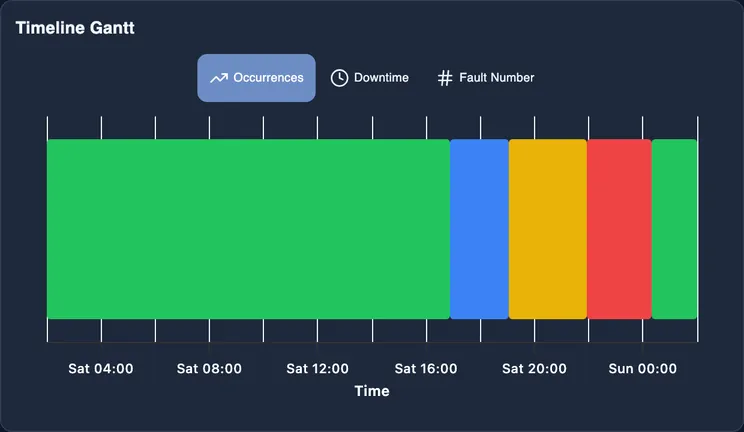
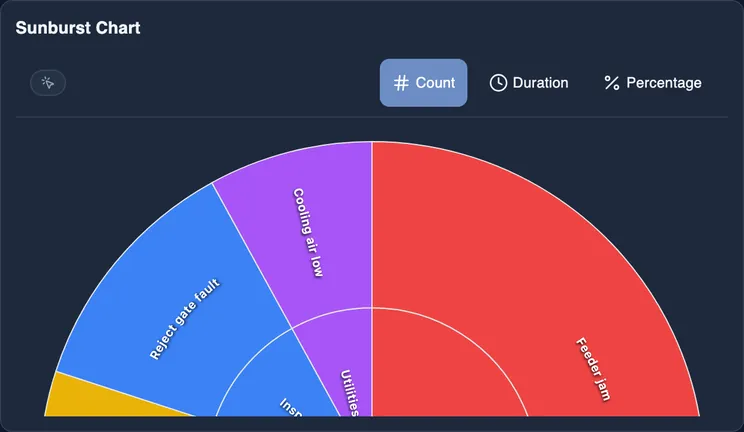
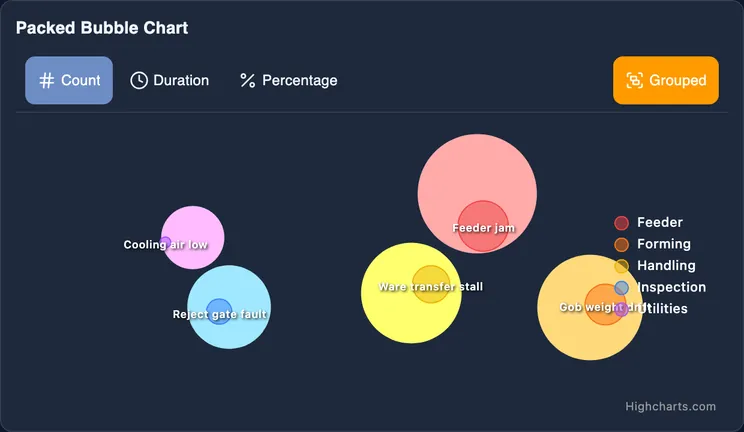
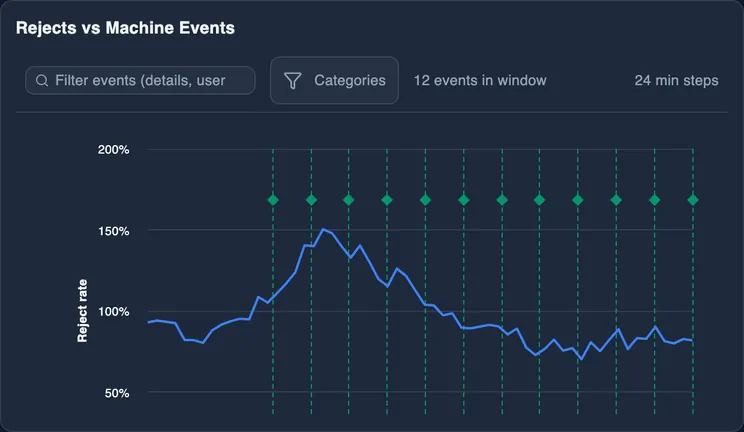
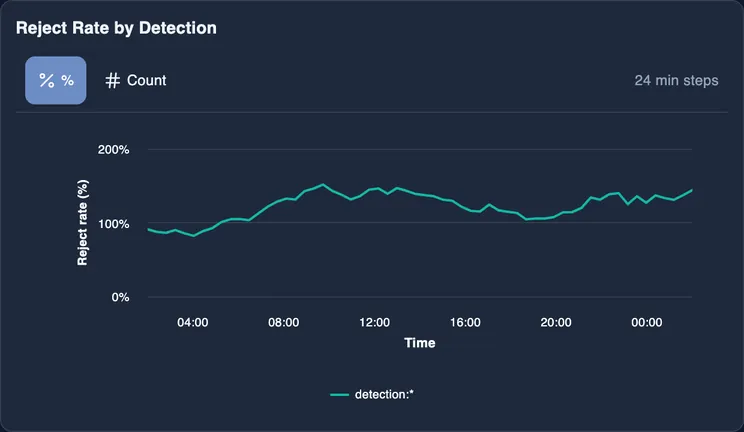
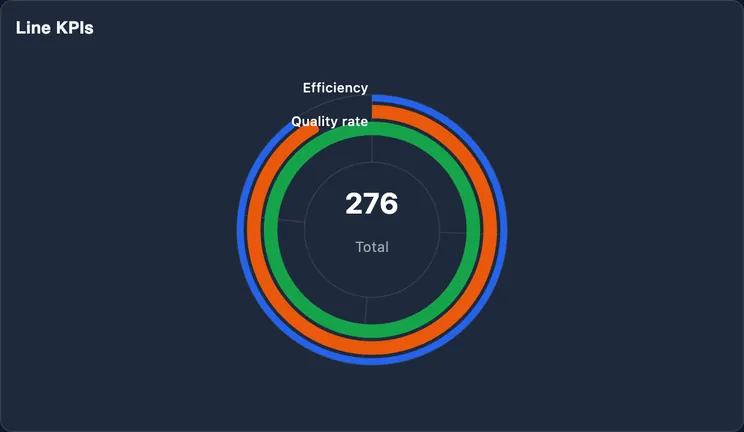
Pick from more than 50 widgets: reject rate, SPC control charts, Pareto, heatmaps, uptime and downtime, rejects by machine, mold, cavity or defect. Each widget keeps its own time window. Share a dashboard with your team, or put it on the plant TV.
See the reject, not just the count.
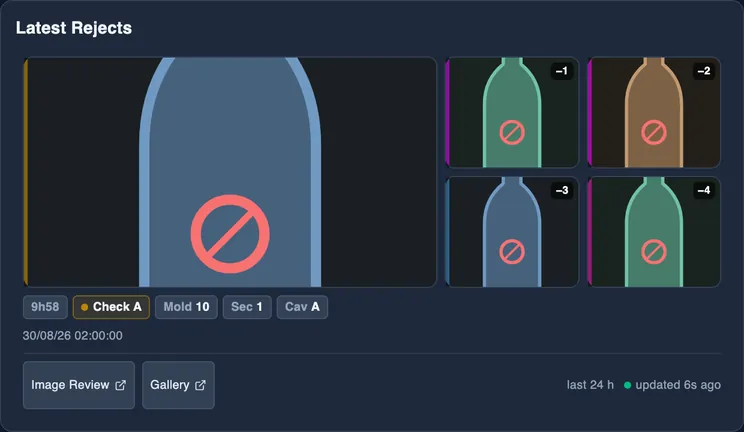
The image of every rejected container is a click away, by machine, mold, cavity and defect. Review a shift in minutes, tag what matters, and go back in time to the moment it started.
- Gallery, lightbox and pixel measurement
- Filter by mold, cavity, defect or your own tags
- Linked to the Defect Guide and the reject counters
Your plant, as a living model.
Walk the line from the furnace to the palletizer. Each machine shows its state, its rejects and its alarms in a 3D synoptic your control room can keep on the wall.
- Live status and reject rail on every machine
- One layout per line, built in the admin editor
- Runs in any browser and in TV mode
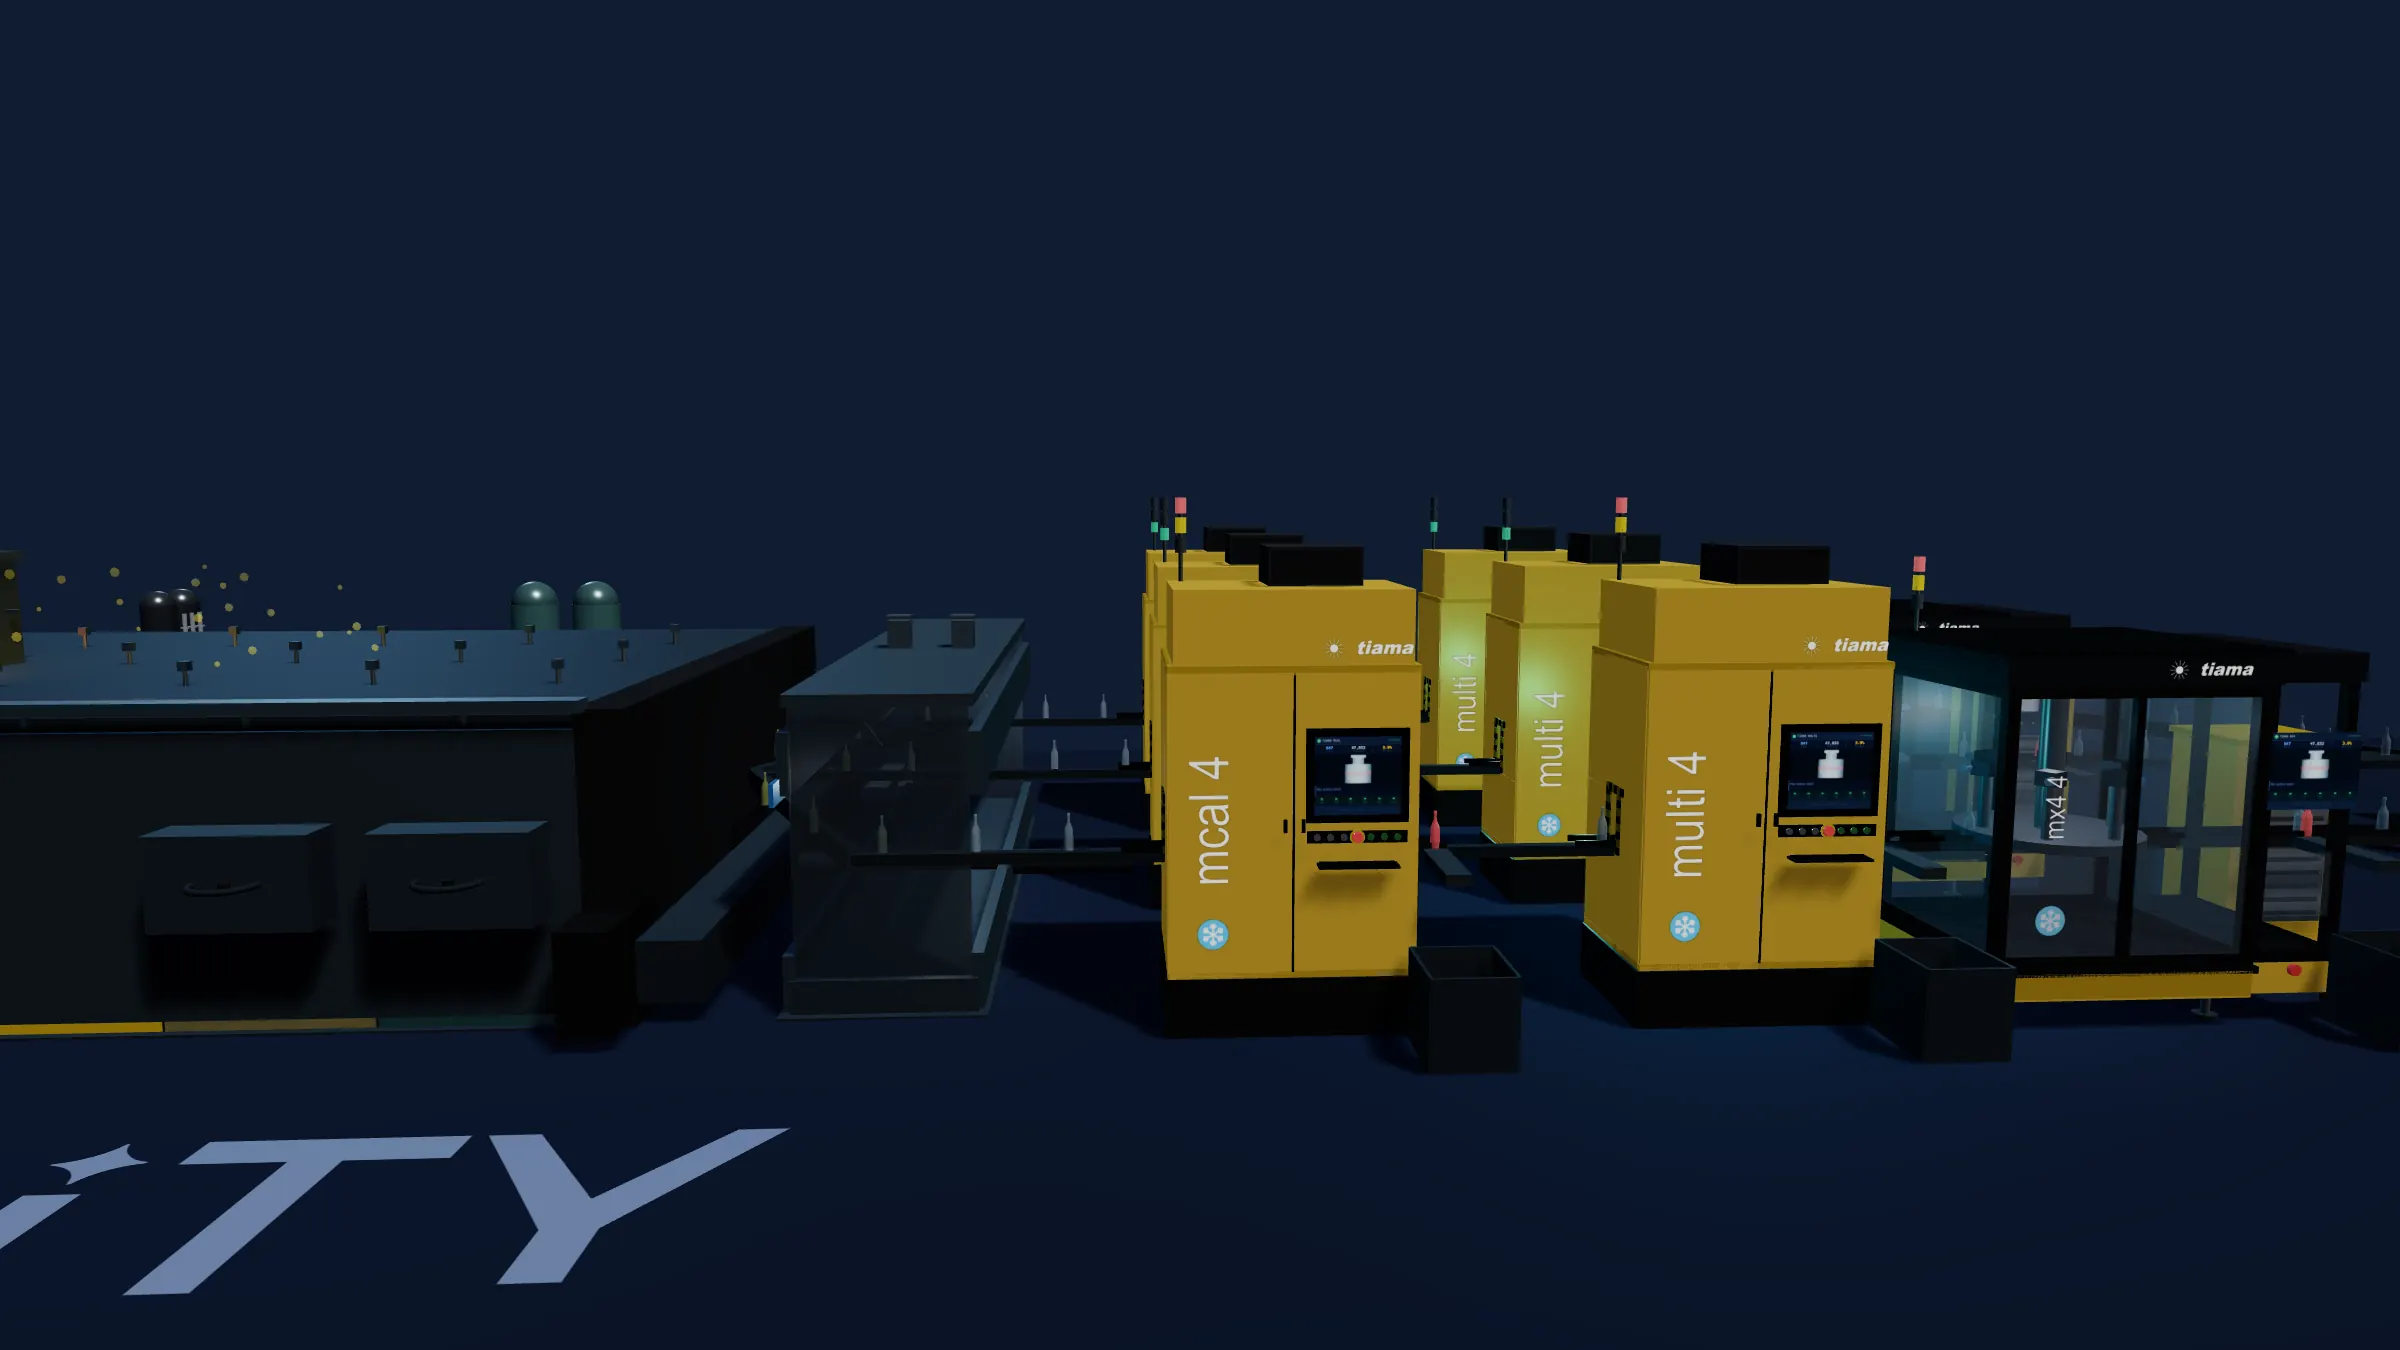 3D synopticLive · 3D synoptic
Know before the shift does.
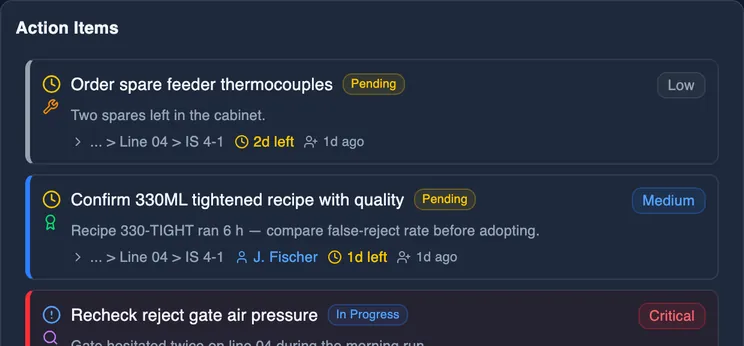
Set alarm rules on any metric and get notified by email or in the app. Schedule PDF reports to arrive before the morning meeting. Turn findings into action items with an owner and a due date.
Ask your plant a question.
The KLARiTY assistant answers from your live data: what changed since yesterday, which defect is climbing, where the rejects come from. It shows the trend, and the trace behind every answer.
- Grounded in your dashboards, alarms, news and action items
- Respects each user’s access rights
- Available on every page, in your language
From symptom to root cause.
Explore any variable, correlate rejects with process signals and operator events, and pin the interval that hurt. Analysis Studio, Data Cube and Root Cause are built in.
Built for the whole glass plant.
One sign-in, one hierarchy from the group down to each cavity, and every module follows the scope you pick.
Track & Trace
Follow items and containers along the line and across the fleet.
Job File History
Every job-file change on every machine, compared across plants.
Defect Guide
A visual catalogue of defects, linked to what the cameras see.
Forming Analysis
Heatmaps of forming variables, section by section, cavity by cavity.
Camera Health
Know when an inspection camera drifts, before it costs you rejects.
iPhone & iPad
KLARiTY on iOS, with the plant in your pocket and scans on the floor.
TV mode
Dashboards and the 3D synoptic, full screen on the plant floor.
17 languages
Every screen in the language of the shift.
From the machine to your screen in seconds.
No change to the machines. KLARiTY connects the inspection machines and the plant systems you already own, and serves your data from a European cloud.
Machines and plant systems
Counters, results and images from the inspection machines, plus SCADA, MES, ERP and laboratory data.
KLARiTY connector
A small service at the plant collects and forwards, securely, with nothing exposed to the internet.
KLARiTY cloud
Google Cloud, hosted in the European Union. Encrypted in transit and at rest.
Your team
Web, plant TV and iOS. Accounts approved by your organisation and by ours.
Let’s talk about your lines.
A 30-minute call with the KLARiTY team: your plants, your machines, and what you would see on day one.
The button opens an email to the KLARiTY team. We come back to you with a few time slots.
Also for can making, PET and filling lines.
The same platform and the same modules, with line templates for can making, PET and filling lines.
Cans
Can making end to end: bodymakers, decorators, neckers and inspection.
PET
Preforms, blow moulding, inspection and packing.
Filling
Filler, capper, labeller, coder, and the inspection between them.